Scanz User Interface
The Scanz software that controls ZyVector provides the fundamental functionality for STM imaging, but its true strength lies in the ability to automate almost all aspects of operation in order to perform atomically precise lithography most efficiently.
Scanz is contained within a single window – to the left are the Control Panels where settings are changed, and to the right are the View tabs, where STM images are viewed, and analyzed, and from where scripts can run.
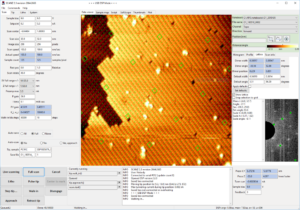
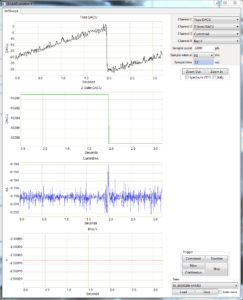
The ZyVector software, Scanz, showing the main Scan control tab and the Data Viewer tab.
Control Panel Tabs
For routine imaging, the user will mostly make use of the Scan Tab, allowing for movement across the surface in x and y, settings for scanning such as image size and pixel resolution, and scan speed. The feedback control loop sensitivity is also set here.
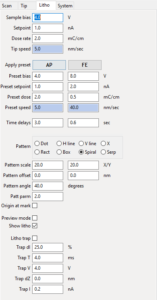
The Litho tab contains controls for voltage, current and dose for different Litho modes. A menu of simple lithography shapes is also provided, and controls for Feedback Controlled Lithography.
Below the Control Panels are the Action Buttons, such as Scan, Litho and Cancel. Actions which are pending will appear in the Queue, from where they can be cancelled individually. Next to the Queue is the Information Panel, which provides feedback on the status, such as movements across the surface, activation or completion of commands etc.
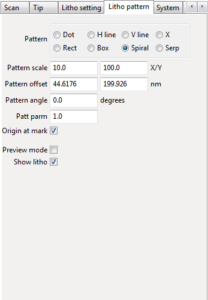
The Litho Settings and Pattern tabs, for performing simple STM lithography.
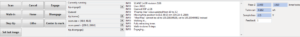
The Action Buttons, Queue and Information Panel.
View Tabs
The main Data Viewer tab shows the live STM image as it scans, along with some simple tools for analyzing line profiles, changing the brightness and contrast etc. Also to be found in the Data Viewer tab is the Lattice panel, which provides the interface to determining the local atomic lattice, and overlaying the pixel grid onto an image, as required for performing lithography aligned to the surface dimer rows.
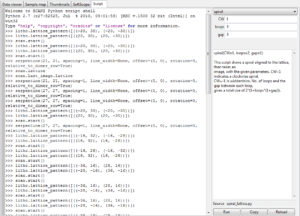
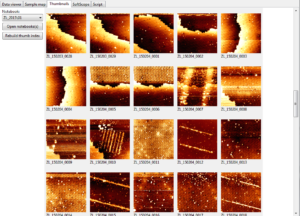
Other view tabs include the Script tab, for running ZyVector scripts either in the command line or using the Script Menu, the Sample Map showing where images have been taken across the scan field, Softscope, which displays any choice of live STM channel data, such as bias, current, XYZ, et al., and the Thumbnails tab, which enables an overview of saved data.
The Softscope, Script and Thumbnails View tabs.